We (Claude code and me) built a Bitcoin Cost of Production (COP) model examining the fundamental cost floor of Bitcoin mining, presented in six analytical panels. We compute all six panels using data spanning from Bitcoin's genesis block (January 3, 2009) through February 2026, and project the model forward to the end of 2032.
The core thesis is simple: Bitcoin has a measurable production cost determined by the electricity and hardware required to mine it. This cost acts as a long-term price floor -- BTC price rarely stays below its cost of production for extended periods, because miners operating at a loss eventually shut down, reducing supply pressure until equilibrium is restored.
Part 1: Data Sources
The model requires four categories of input data:
Hashrate -- The total computational power of the Bitcoin network, measured in terahashes per second (TH/s). Sourced from the blockchain.com API (api.blockchain.info/charts/hash-rate), which provides daily observations since genesis. Our dataset contains 6,249 daily observations from January 3, 2009 to February 19, 2026. The network has grown from effectively zero to over 1,020 EH/s (1.02 billion TH/s) -- a factor of roughly 10^15 over 17 years.
BTC Price -- Daily close price of BTC-USD. Sourced from Yahoo Finance via the yfinance library. Reliable daily data begins September 17, 2014 (when Yahoo started tracking BTC). Our dataset contains 4,174 daily observations through February 20, 2026, with the latest price at $67,854.
Mining Hardware Database -- A hand-compiled database of 71 mining devices: 8 pre-ASIC era machines (CPU, GPU, FPGA from 2009-2012) and 63 ASIC miners from the Avalon A1 (January 2013, 9,393 J/TH) through the Antminer S23 Hyd (January 2026, 9.5 J/TH). Each entry records the device name, release date, hashrate capacity (TH/s), power consumption (W), and energy efficiency (J/TH). This database is the empirical foundation for estimating how efficiently the network converts electricity into hashes.
Halving Schedule -- Bitcoin's block reward halves approximately every 210,000 blocks (~4 years). The known and projected schedule:
| Date | Block Reward | Event |
|---|---|---|
| 2009-01-03 | 50 BTC | Genesis |
| 2012-11-28 | 25 BTC | 1st halving |
| 2016-07-09 | 12.5 BTC | 2nd halving |
| 2020-05-11 | 6.25 BTC | 3rd halving |
| 2024-04-20 | 3.125 BTC | 4th halving |
| 2028-04-15 | 1.5625 BTC | 5th halving (projected) |
| 2032-04-15 | 0.78125 BTC | 6th halving (projected) |
Part 2: The COP Model
The cost of production is derived from first principles of electricity consumption:
COP_electrical = (Hashrate * Efficiency * 24 * PUE * Electricity_Price) / (1000 * Block_Reward * 144)
COP_total = COP_electrical / 0.60
Fixed parameters:
-
Electricity price: $0.05/kWh (industry average for large-scale mining operations)
-
PUE (Power Usage Effectiveness): 1.10 (cooling and infrastructure overhead)
-
Electricity share of total mining cost: 60% (the remaining 40% covers hardware depreciation, labor, rent, and other operational expenses)
The division by 0.60 converts the electricity-only cost into a total cost estimate, reflecting that electricity typically accounts for about 60% of a mining operation's expenses.
Part 3: Network Efficiency Estimation
This is the most challenging part of the model. We do not know the exact hardware composition of the Bitcoin network at any point in time. Instead, we estimate the network-average efficiency (J/TH) using the hardware database and several assumptions.
ASIC era (2013-present): We construct a "best-available" efficiency frontier from the hardware database -- at each point in time, this is the lowest J/TH achievable by any commercially available miner. The actual network average lags behind the frontier because:
-
Miners don't replace hardware immediately upon new releases
-
Older machines remain profitable as long as electricity cost < revenue
-
New hardware takes months to reach full deployment
We apply a lag factor of 1.3x, meaning the network average efficiency is estimated at 1.3 times the best available hardware. This produces an upper and lower bound:
-
Lower bound: 1.05x best (near-optimal fleet, large operations with latest hardware)
-
Central estimate: 1.3x best (network average)
-
Upper bound: 2.0x best (includes significant legacy hardware)
Between known hardware data points, we interpolate in log-space (log-linear interpolation), which correctly handles the exponential nature of efficiency improvements.
Pre-ASIC era (2009-2012): Efficiency values are assigned by technology generation:
-
CPU mining (2009-mid 2010): ~9,000,000 J/TH
-
GPU mining (mid 2010-mid 2011): ~900,000 J/TH
-
FPGA mining (mid 2011-early 2013): ~100,000 J/TH
These values are connected to the ASIC era via smooth log-linear interpolation.
Key efficiency milestones (best available hardware):
| Date | Device | Efficiency |
|---|---|---|
| Jan 2013 | Avalon A1 | 9,393 J/TH |
| Oct 2013 | KnC Saturn | 2,800 J/TH |
| Jan 2014 | KnC Neptune | 700 J/TH |
| Aug 2015 | Antminer S7 | 273 J/TH |
| Jun 2016 | Antminer S9 | 98 J/TH |
| Jun 2018 | Ebit E11++ | 45 J/TH |
| May 2020 | Antminer S19 Pro | 29.5 J/TH |
| Jul 2023 | Antminer S21 | 17.5 J/TH |
| Jan 2026 | Antminer S23 Hyd | 9.5 J/TH |
The improvement from 9,393 to 9.5 J/TH represents a ~1,000x efficiency gain over 13 years. The rate of improvement has slowed considerably -- the early ASIC years saw 100x gains annually, while recent years achieve roughly 15-20% per year. The thermodynamic floor is estimated at approximately 5 J/TH.
Current network average efficiency is estimated at 12.3 J/TH.
Part 4: Efficiency of Bitcoin Mining Hardware
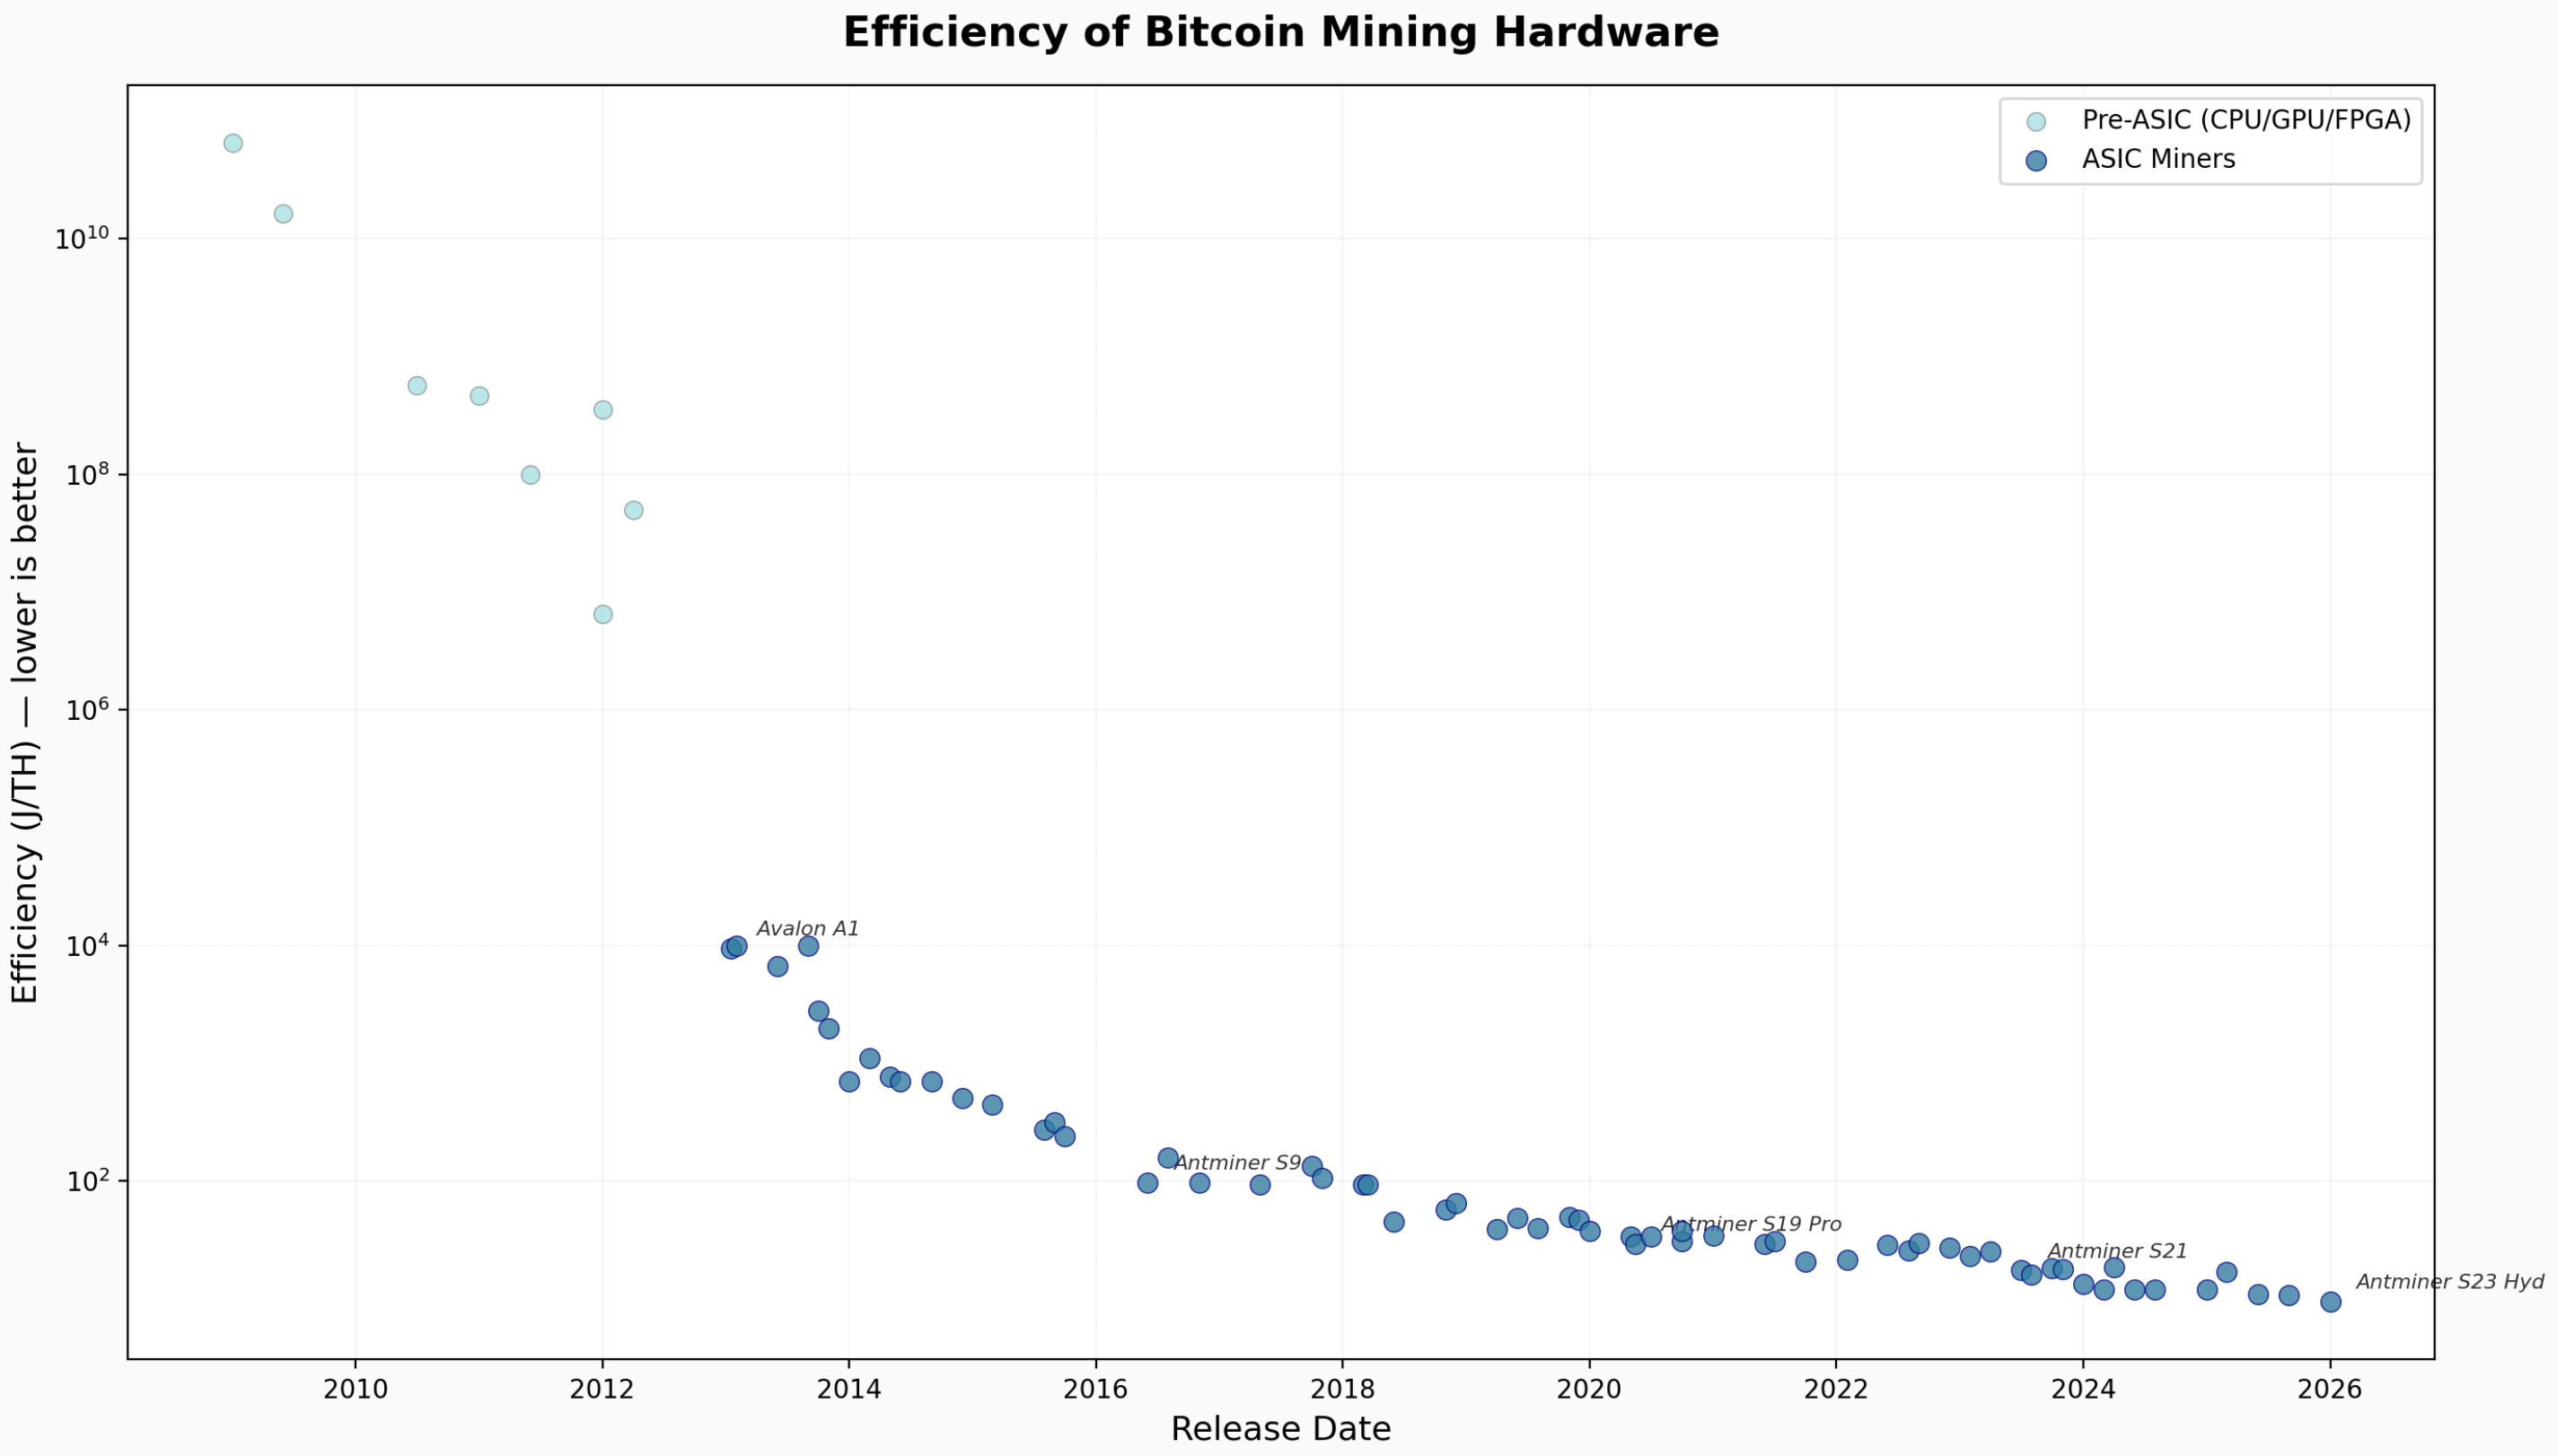
This is the simplest panel and the foundation for all efficiency estimates. It plots every known mining device by release date (x-axis) against its energy efficiency in J/TH (y-axis, log scale).
The scatter plot reveals the full trajectory of mining technology: from CPUs at billions of J/TH through GPUs, FPGAs, and into the ASIC era. The ASIC points form a clear downward curve that begins to flatten in recent years, illustrating the diminishing returns of semiconductor process improvements. The gap between the pre-ASIC era (top of chart, 10^8 to 10^10 J/TH) and modern ASICs (bottom, ~10 J/TH) spans roughly 9 orders of magnitude.
Notable features:
-
The pre-ASIC to ASIC transition (2012-2013) shows the most dramatic efficiency jump in Bitcoin's history
-
Within the ASIC era, the Antminer S9 (2016, 98 J/TH) represents a pivotal moment -- it was the first sub-100 J/TH miner and dominated the network for years
-
Post-2020 improvements are incremental, suggesting we are approaching practical efficiency limits
Part 5: Bitcoin Mining Efficiency
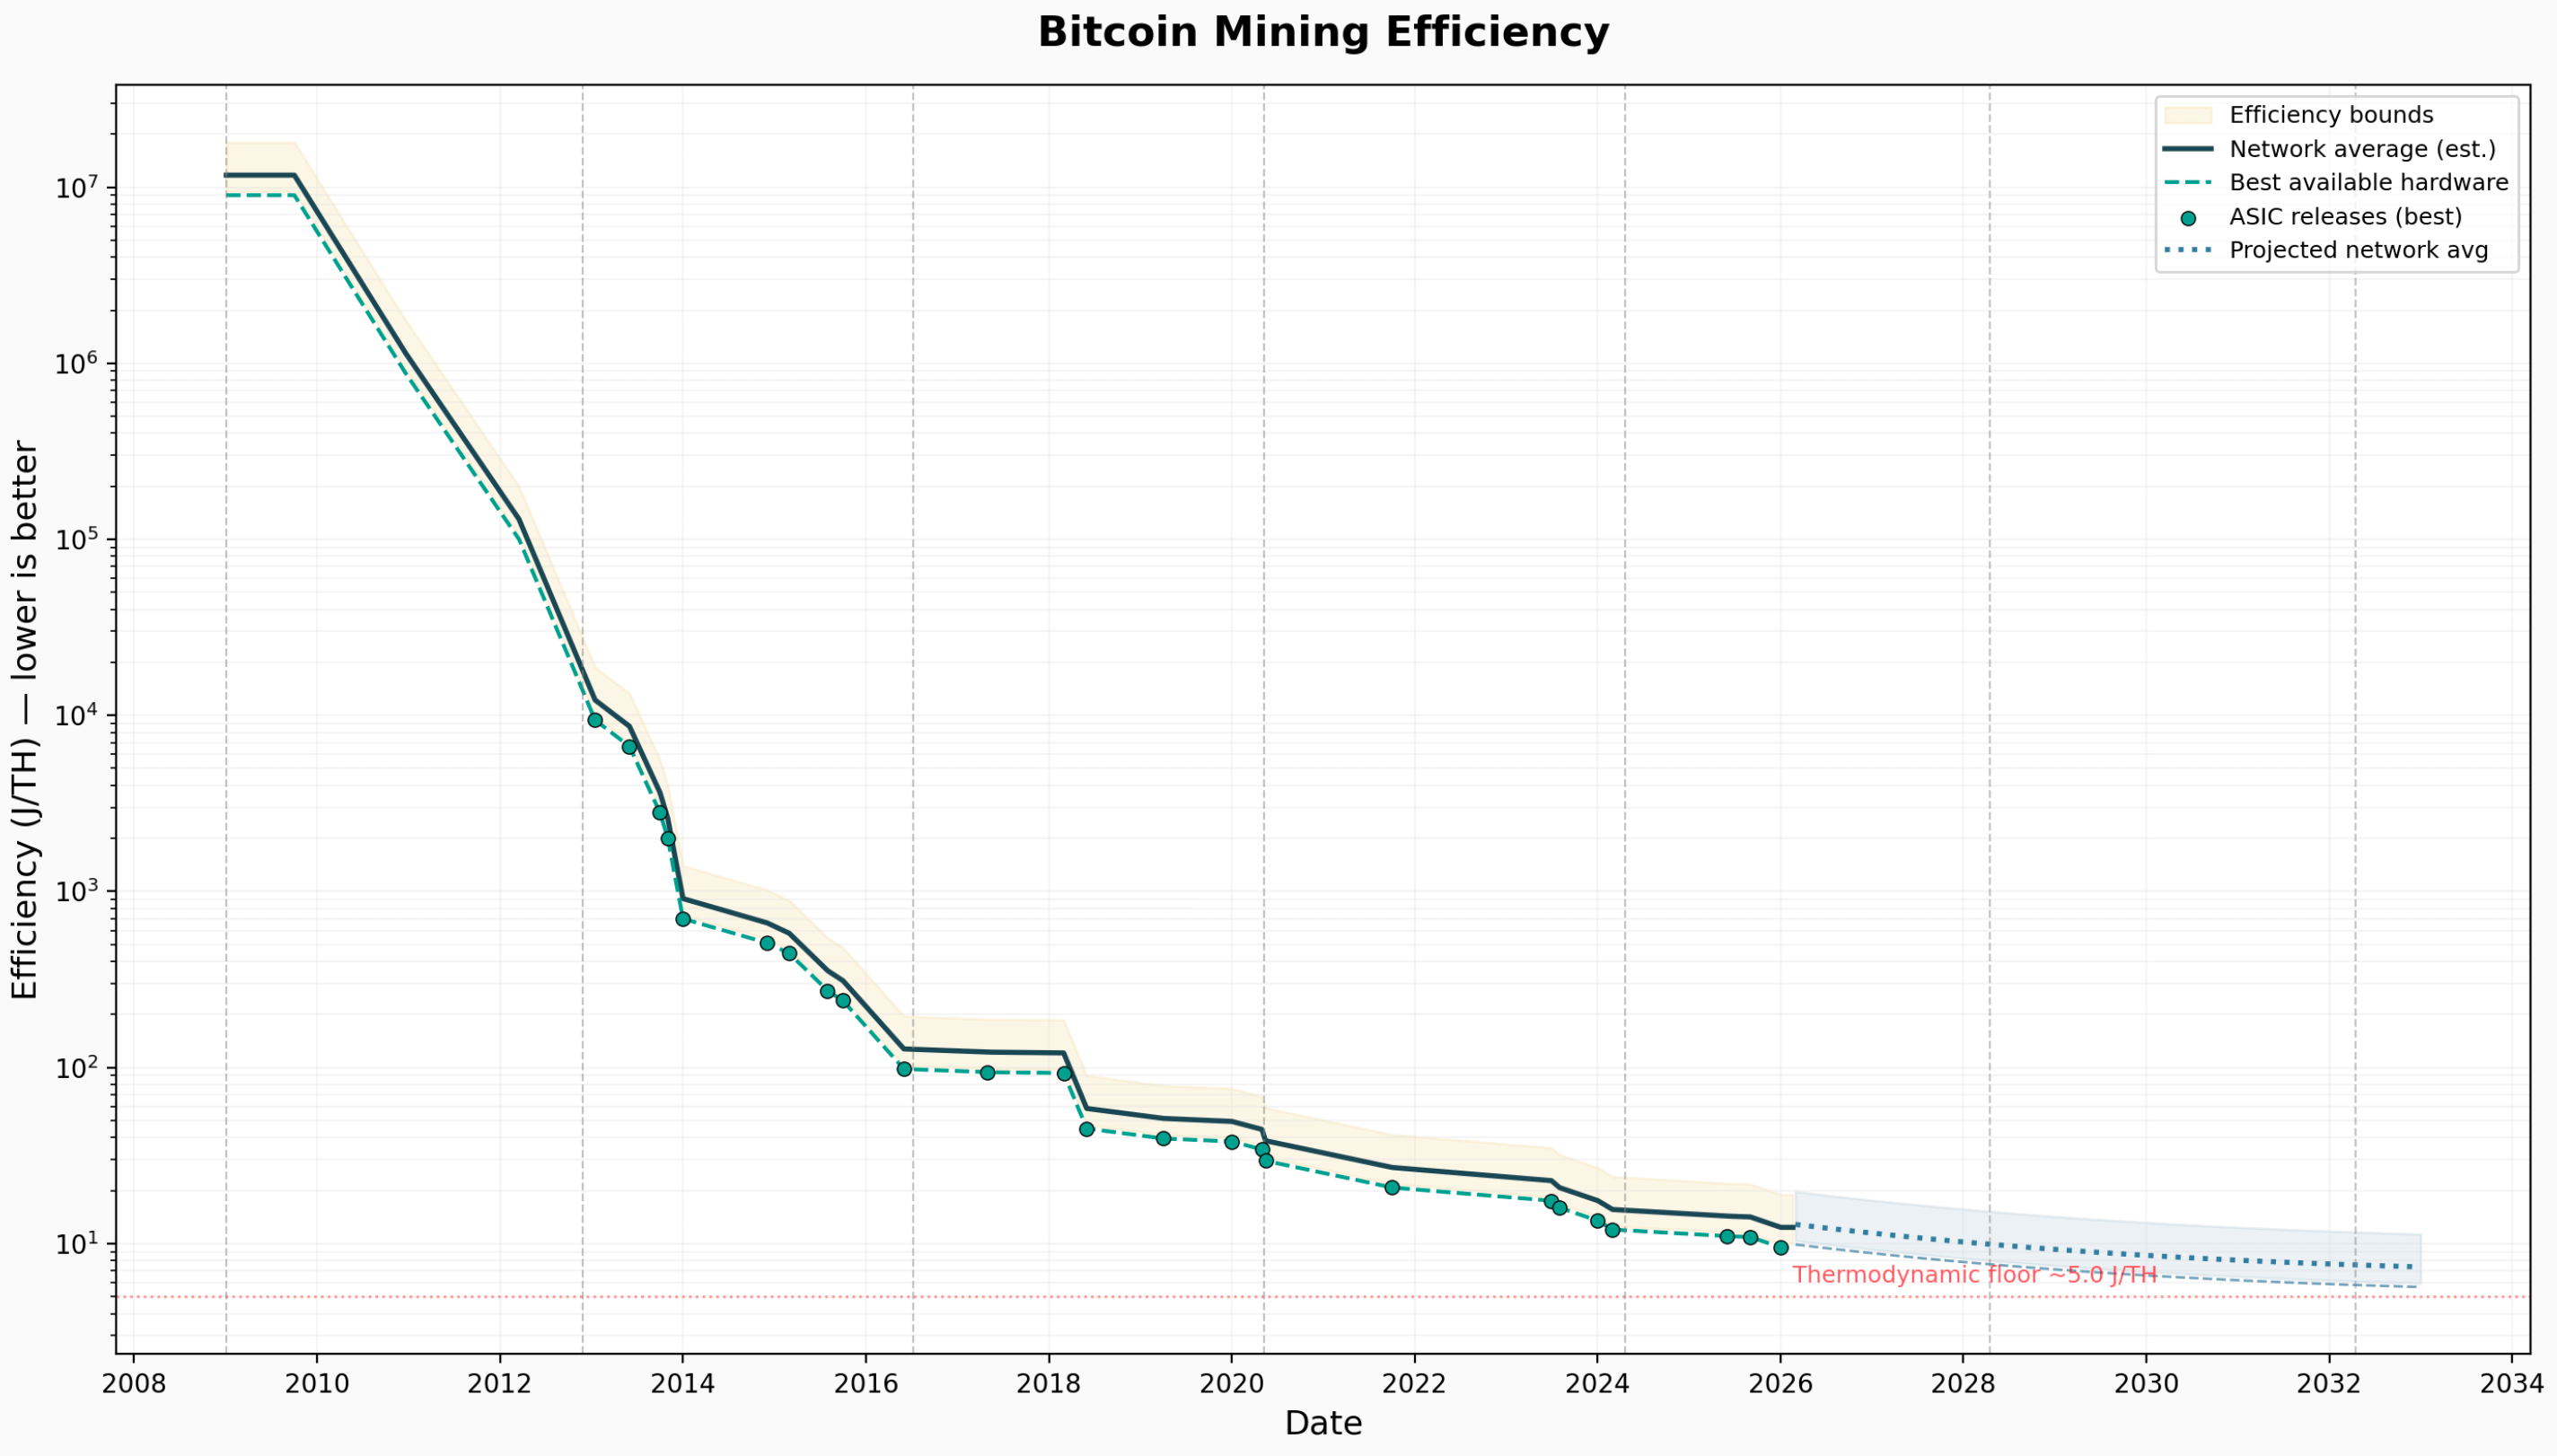
This panel converts the hardware scatter data into a continuous time series showing how the network's average mining efficiency has evolved. It displays three curves on a log-scale y-axis:
- Best available hardware (dashed line): The efficiency frontier -- the lowest J/TH achievable at each point in time
- Network average estimate (solid line): Best hardware * 1.3 lag factor
- Upper/lower bounds (shaded region): The uncertainty range
The ASIC release data points are overlaid as scatter dots for reference. A horizontal red dashed line marks the thermodynamic floor at 5 J/TH.
The projected portion (2026-2032) extends the trend using an exponential decay fit to recent data (2019 onward), asymptotically approaching the 5 J/TH floor. By end of 2032, the network average is projected to reach approximately 7.4 J/TH.
Key observation: the log-scale presentation reveals that the rate of efficiency improvement has been decelerating steadily. The early ASIC years (2013-2016) show steep descent, while the 2020s portion is nearly flat on the log scale, indicating we are approaching fundamental physical limits of silicon-based computation.
Part 6: Bitcoin Total Hashrate
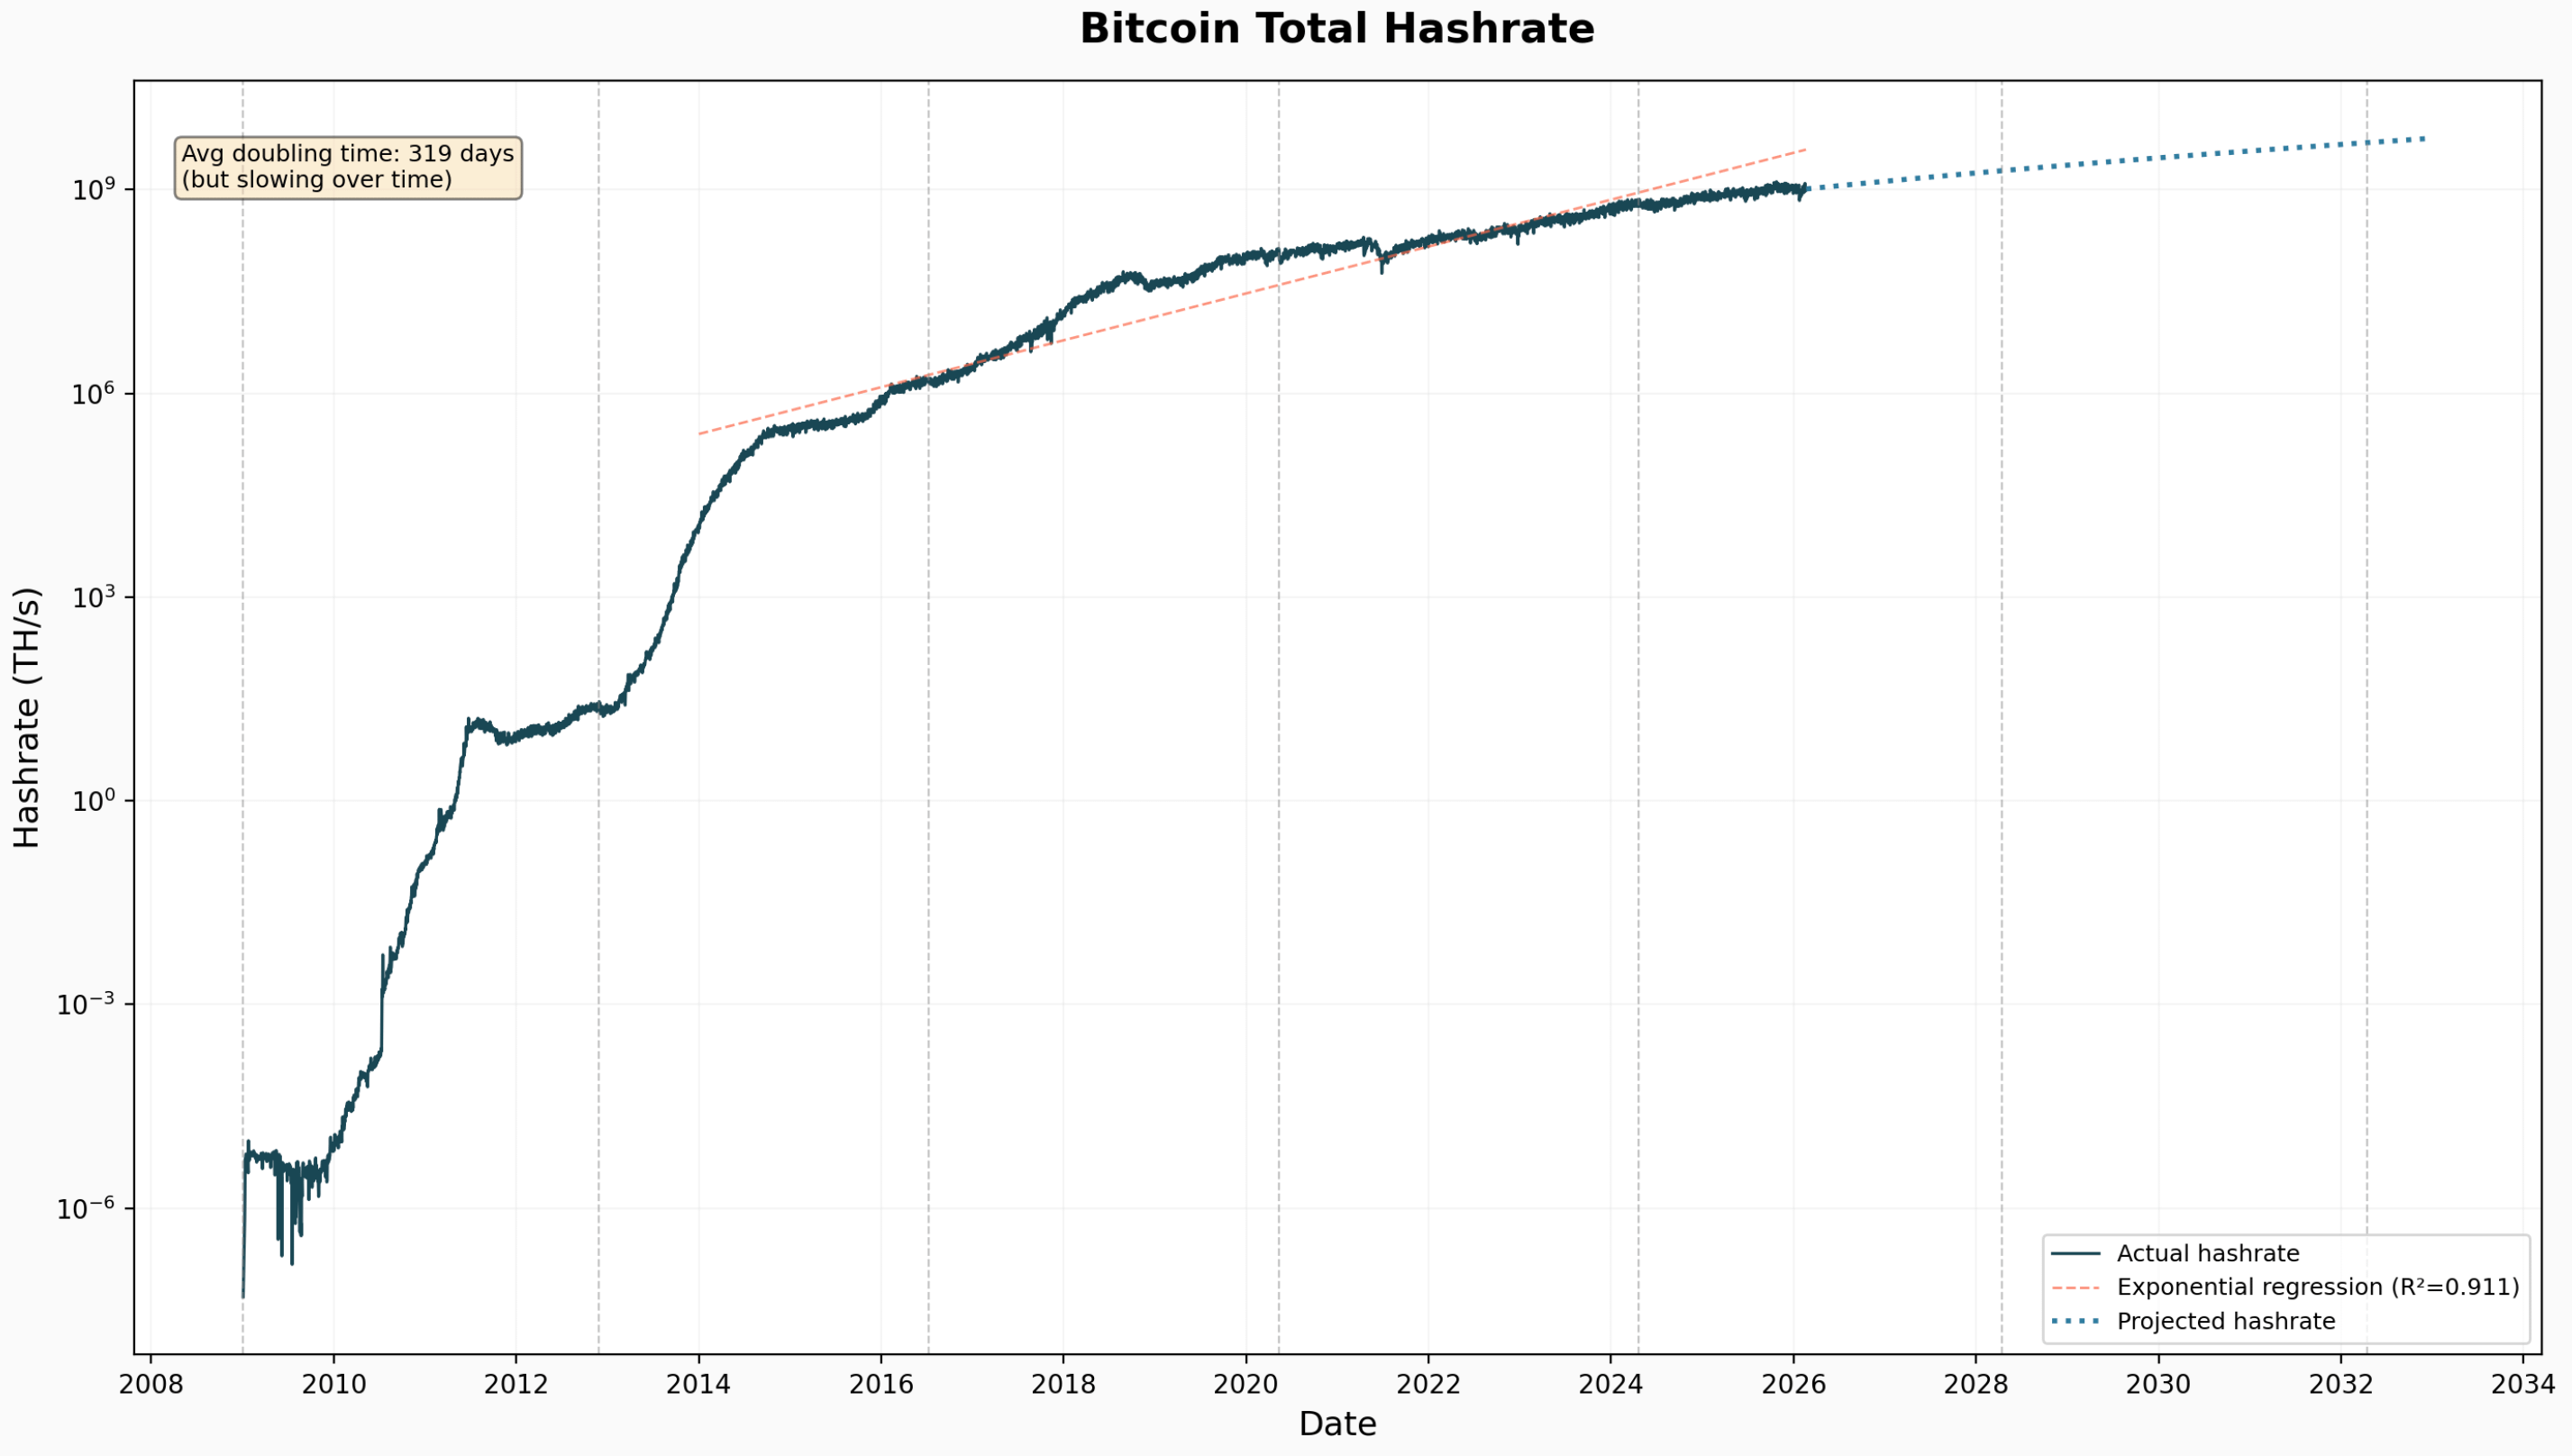
This panel shows the total network hashrate on a log-scale y-axis from genesis through 2032.
Historical hashrate milestones:
-
Jan 2012: 9.5 TH/s
-
Jan 2014: 15,200 TH/s (15.2 PH/s)
-
Jan 2016: 864,200 TH/s (864 PH/s)
-
Jan 2018: 17.7 EH/s
-
Jan 2020: 109.2 EH/s
-
Jan 2022: 187.5 EH/s
-
Jan 2024: 521.3 EH/s
-
Feb 2026: 1,020.6 EH/s (current)
An exponential regression line is fitted to the 2014-2026 data, yielding R^2 = 0.911 with an average doubling time of approximately 319 days. However, the annotation notes that this growth rate is slowing over time -- the simple exponential model is increasingly inaccurate for long-term projections.
The projection to 2032 uses the doubling-time trend model (see Part 7) rather than a fixed exponential, producing a projected hashrate of approximately 5,700 EH/s by end of 2032 -- roughly 5.6x the current level.
Visible features:
-
Brief hashrate dips during the 2018 bear market and the 2021 China mining ban
-
Each halving is marked with a vertical dashed line; hashrate typically plateaus briefly around halvings as marginal miners shut down, then resumes growth
Part 7: Hashrate Doubling Time
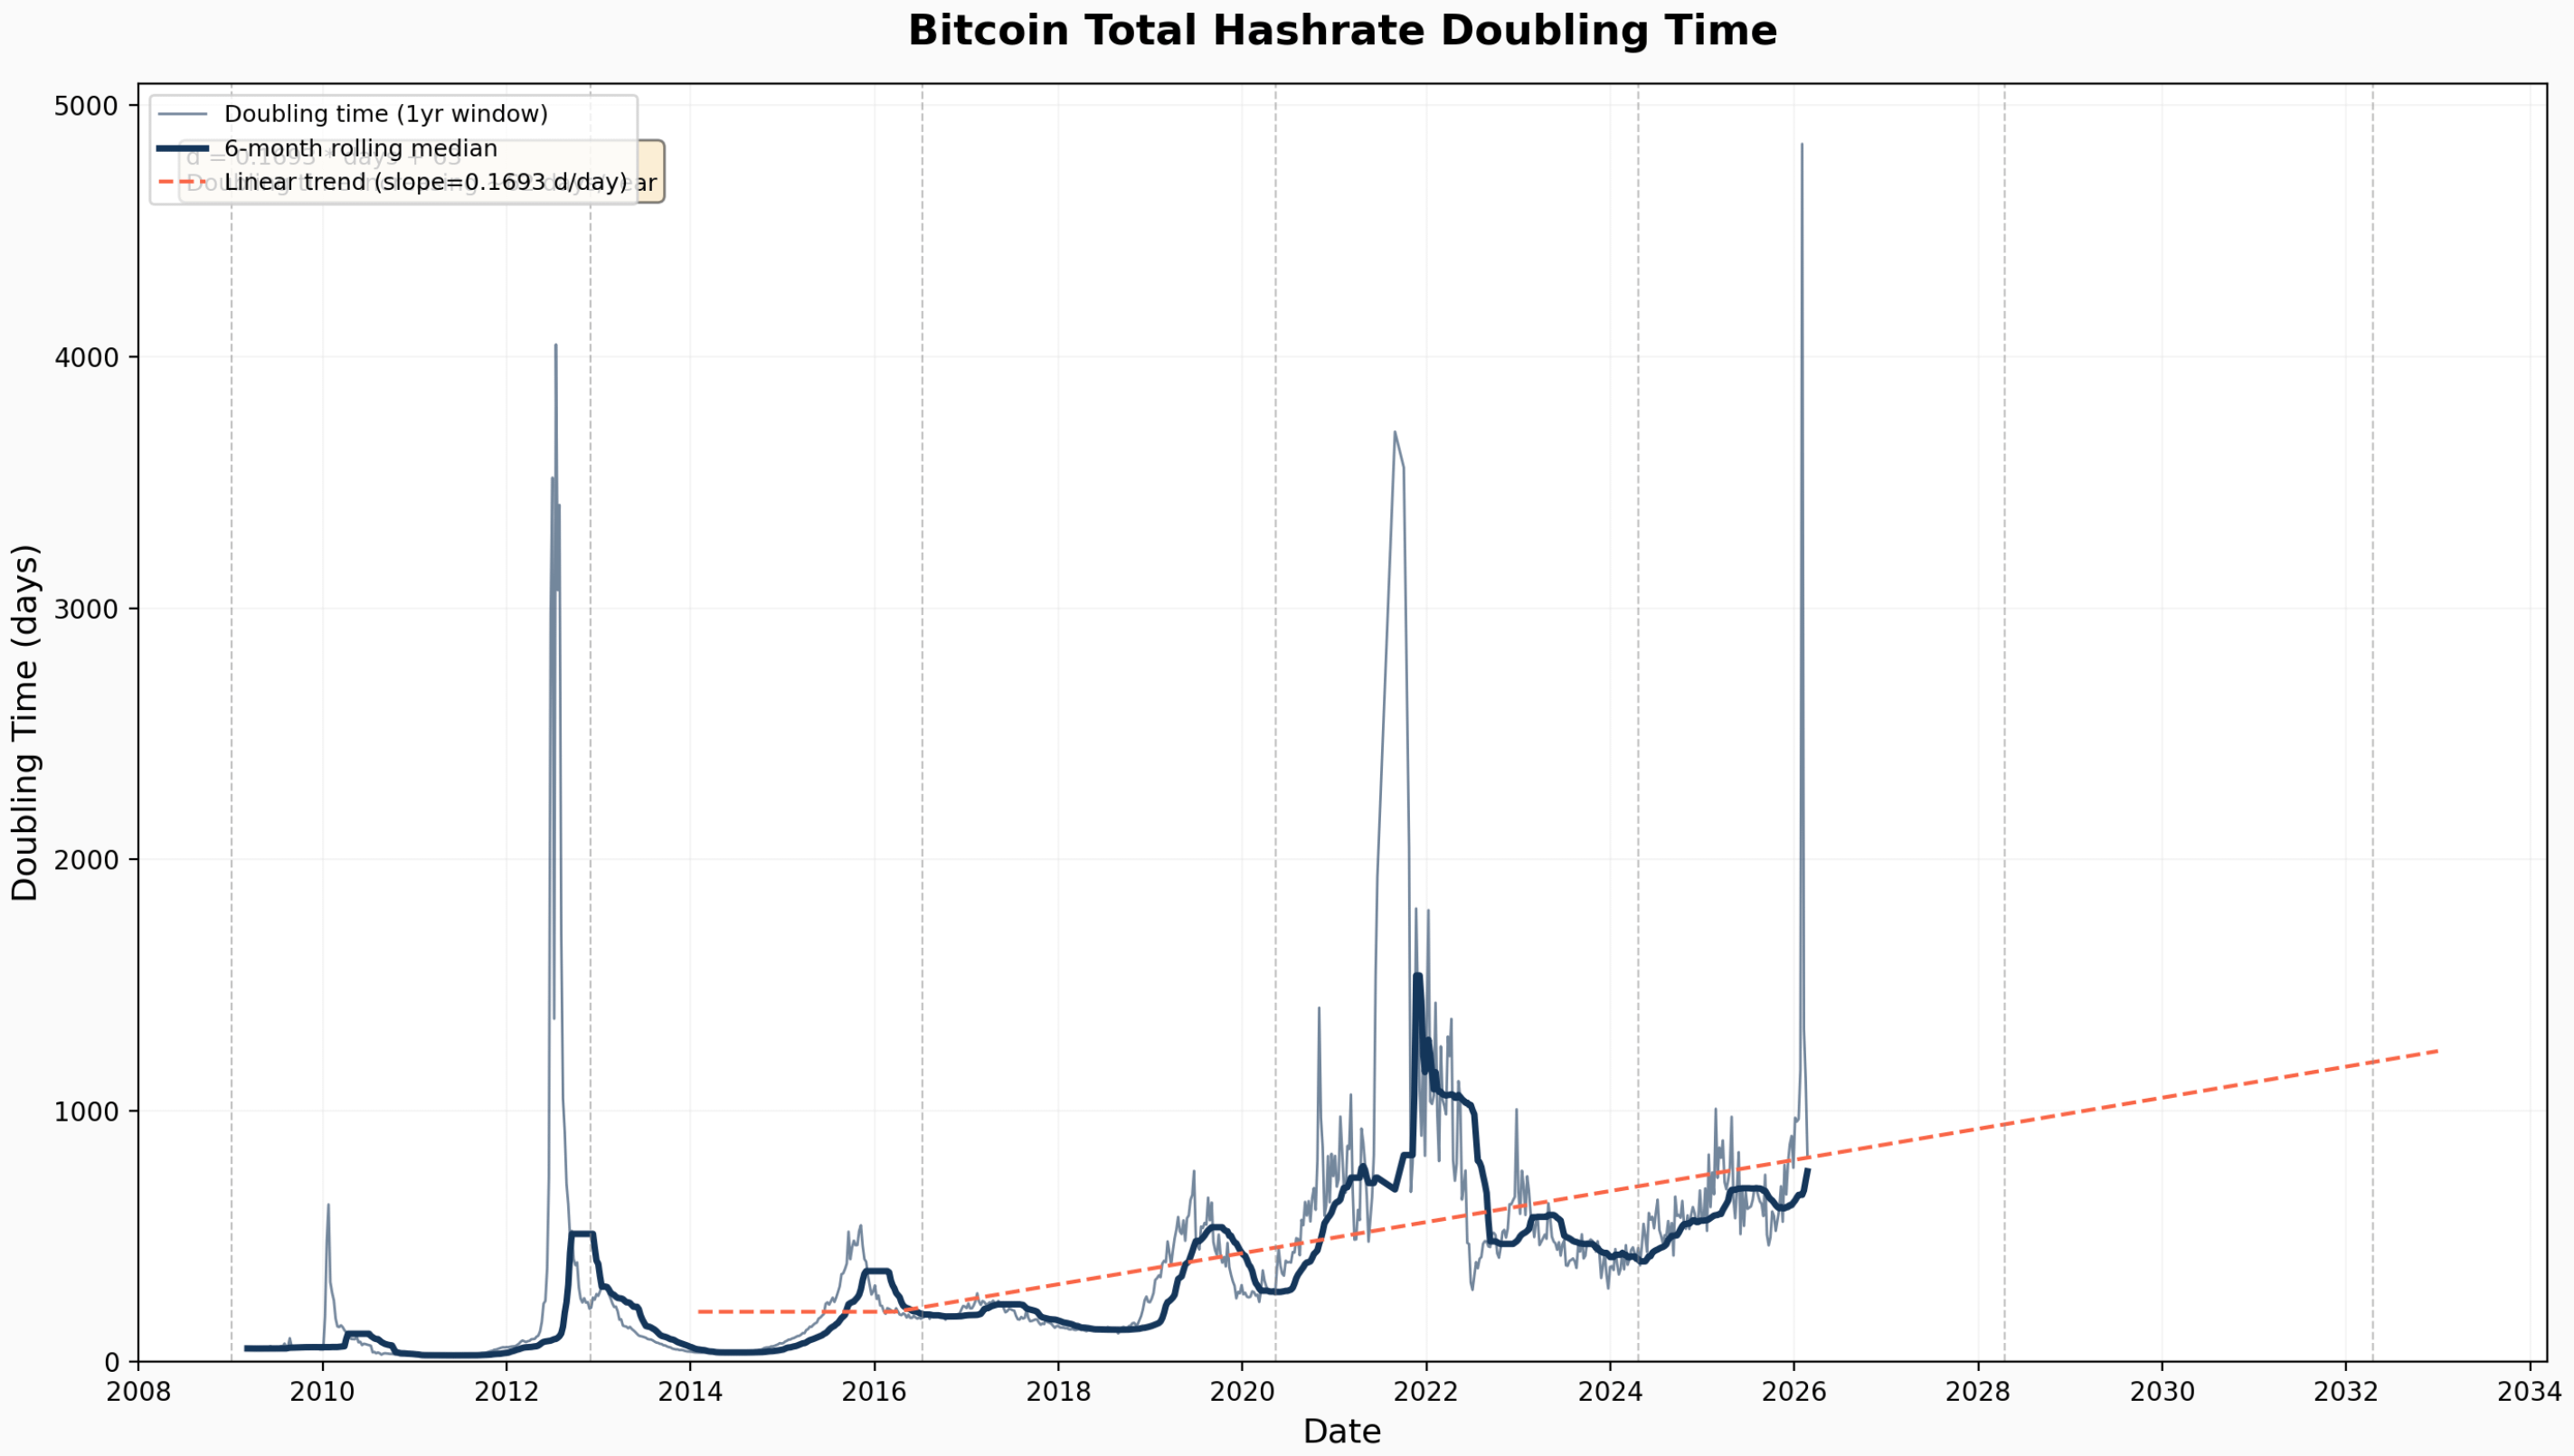
This panel examines how quickly the network's computational power doubles, and how that rate has changed over time. Doubling time is computed using a 1-year rolling window:
Doubling_Time = 365 * ln(2) / ln(HR_end / HR_start)
The raw signal (light line) is noisy, so a 6-month rolling median (bold line) is overlaid.
Doubling time by era:
-
2012: ~239 days
-
2015: ~235 days
-
2018: ~132 days (rapid growth during ASIC scaling)
-
2021: ~824 days (post-China ban recovery, mature network)
-
2024: ~515 days
-
2025+: ~692 days
A linear trend line is fitted to the 2014-onward data, revealing that doubling time is increasing at approximately 62 days per year. This is the critical insight for long-term hashrate projection: Bitcoin's hashrate growth is not purely exponential but rather follows a decelerating growth pattern. The network is maturing.
Spikes in doubling time correspond to periods where hashrate temporarily declined or stagnated -- most notably the 2021 China mining ban (which caused a ~50% hashrate drop) and the 2022 bear market.
This trend is used directly in the hashrate projection: rather than assuming a constant growth rate, the model extrapolates the increasing doubling time, producing more conservative (and realistic) long-term hashrate estimates.
Part 8: Mining Parameters Table
This panel presents a summary table of key mining parameters at each halving date, the current date, and projected future dates. It serves as a quick reference for the model's inputs and outputs at critical moments in Bitcoin's history.
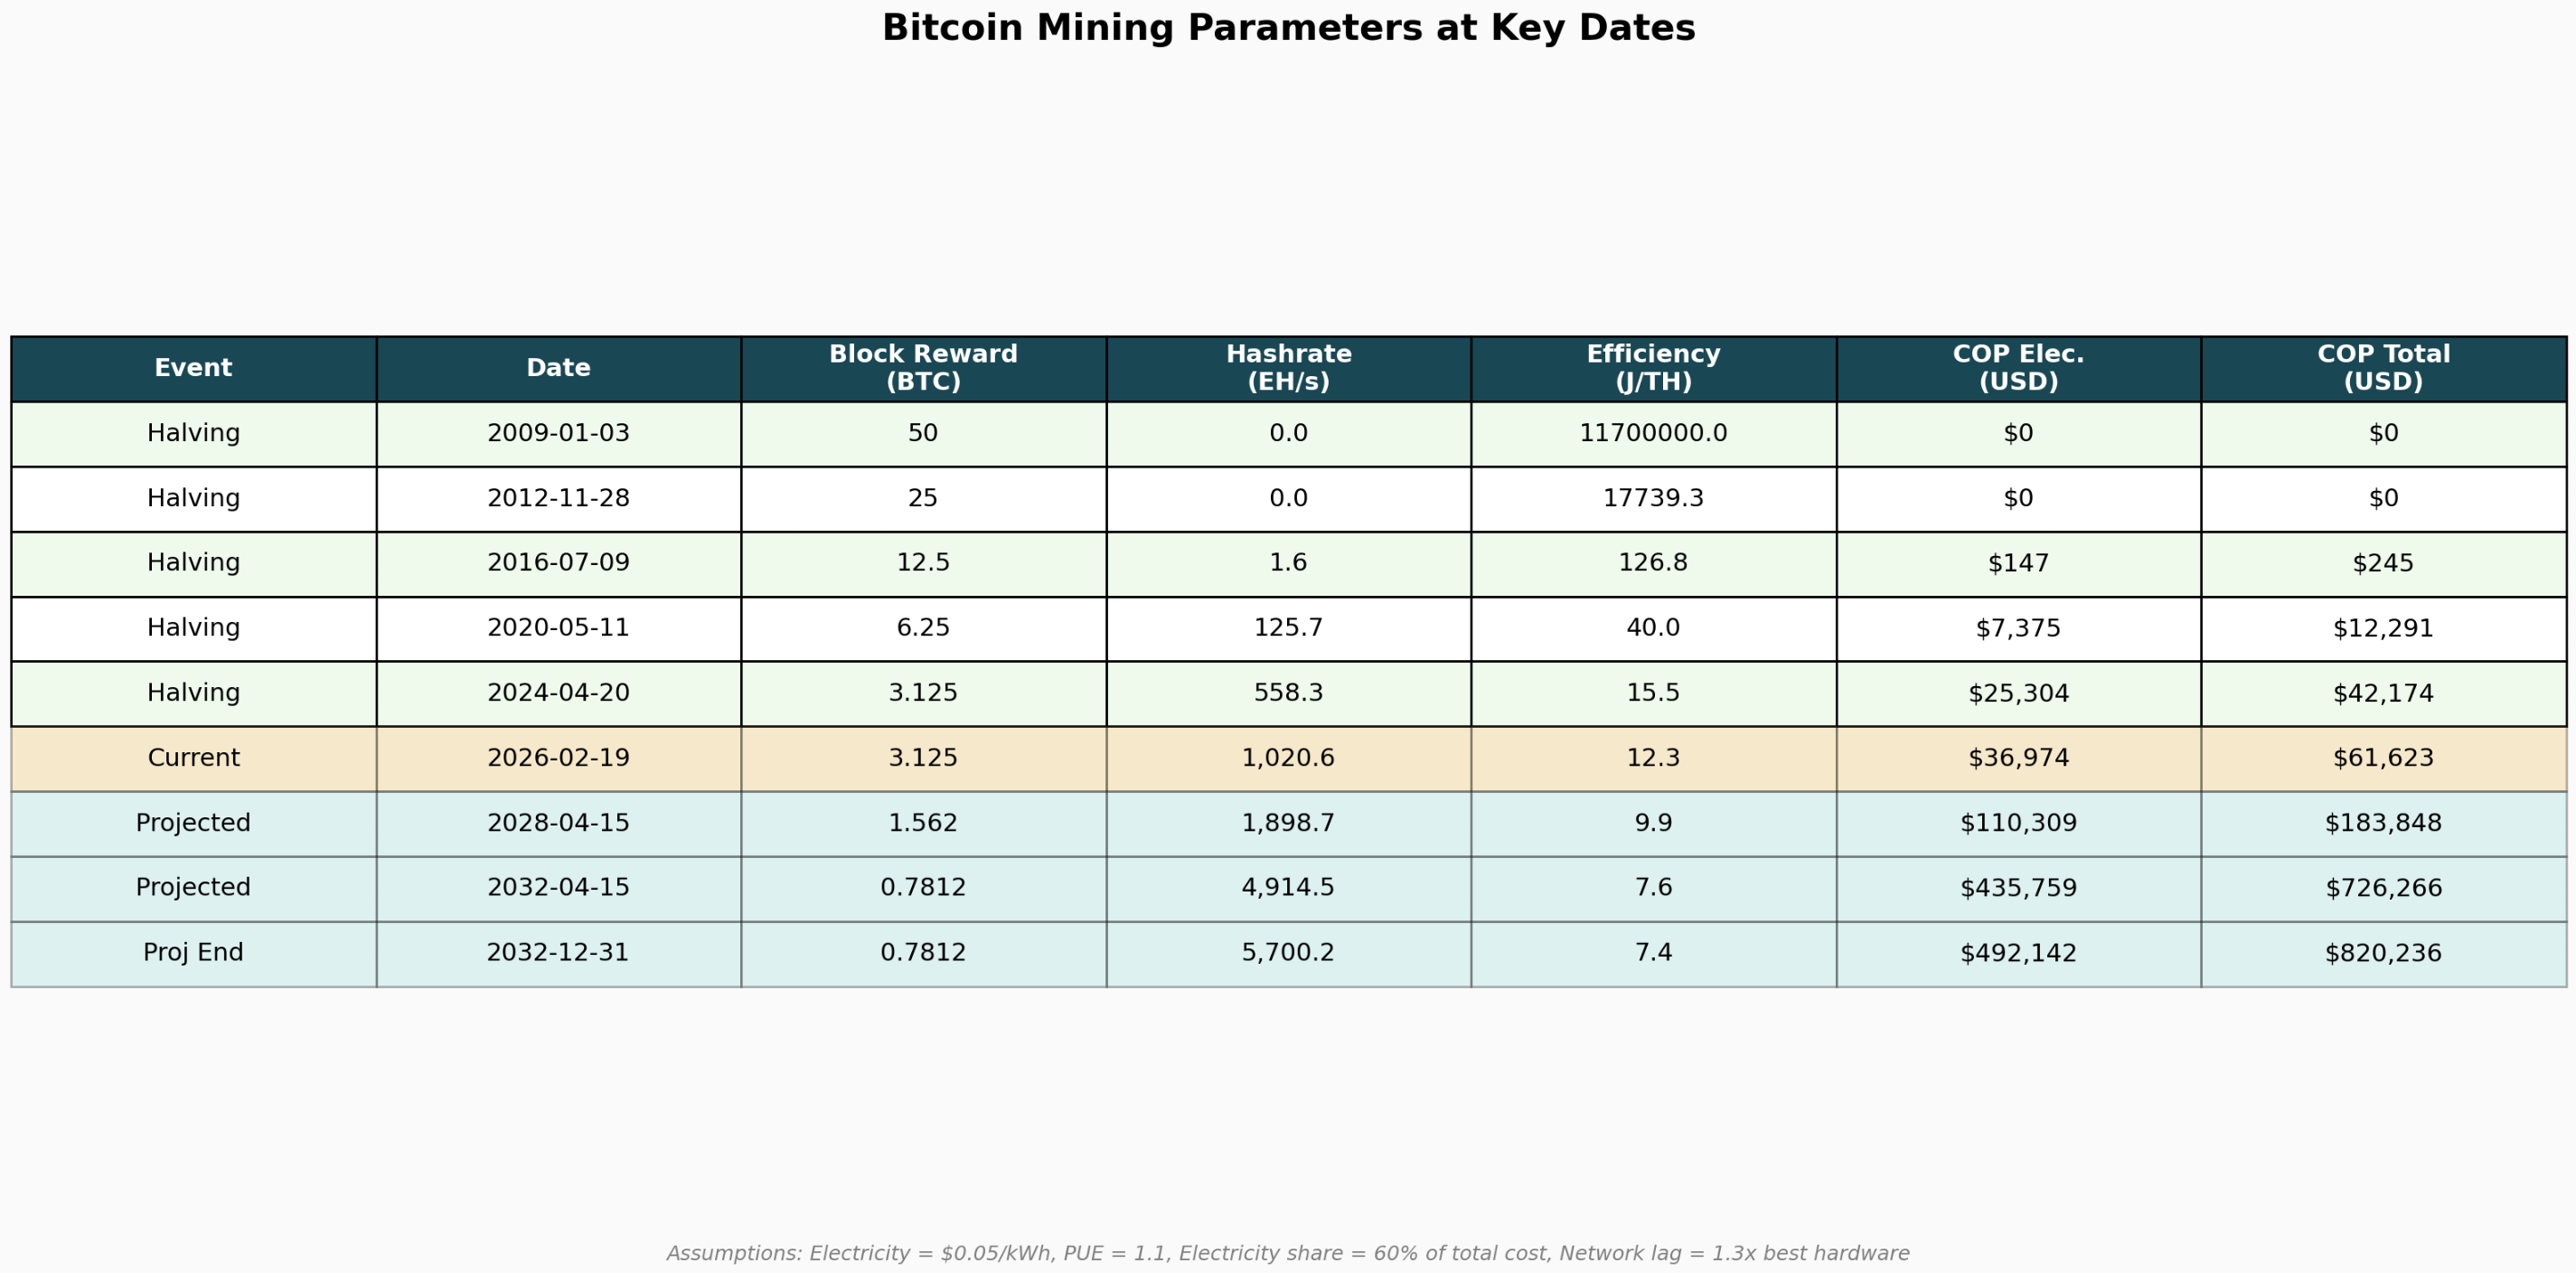
Key observations from the table:
-
COP roughly doubles at each halving when hashrate and efficiency remain similar (since the block reward halves, the cost per BTC doubles)
-
In practice, the ratio is not exactly 2x because hashrate and efficiency also change around halving dates
-
The 2016 halving: $118 -> $232 (2.0x)
-
The 2020 halving: $6,239 -> $9,470 (1.5x, attenuated by concurrent hashrate growth)
-
The 2024 halving: $23,314 -> $45,469 (2.0x)
-
The current COP of $61,623 compared to the BTC price of $67,854 gives a ratio of 1.10x -- meaning BTC is trading only 10% above its estimated cost of production, a historically tight margin
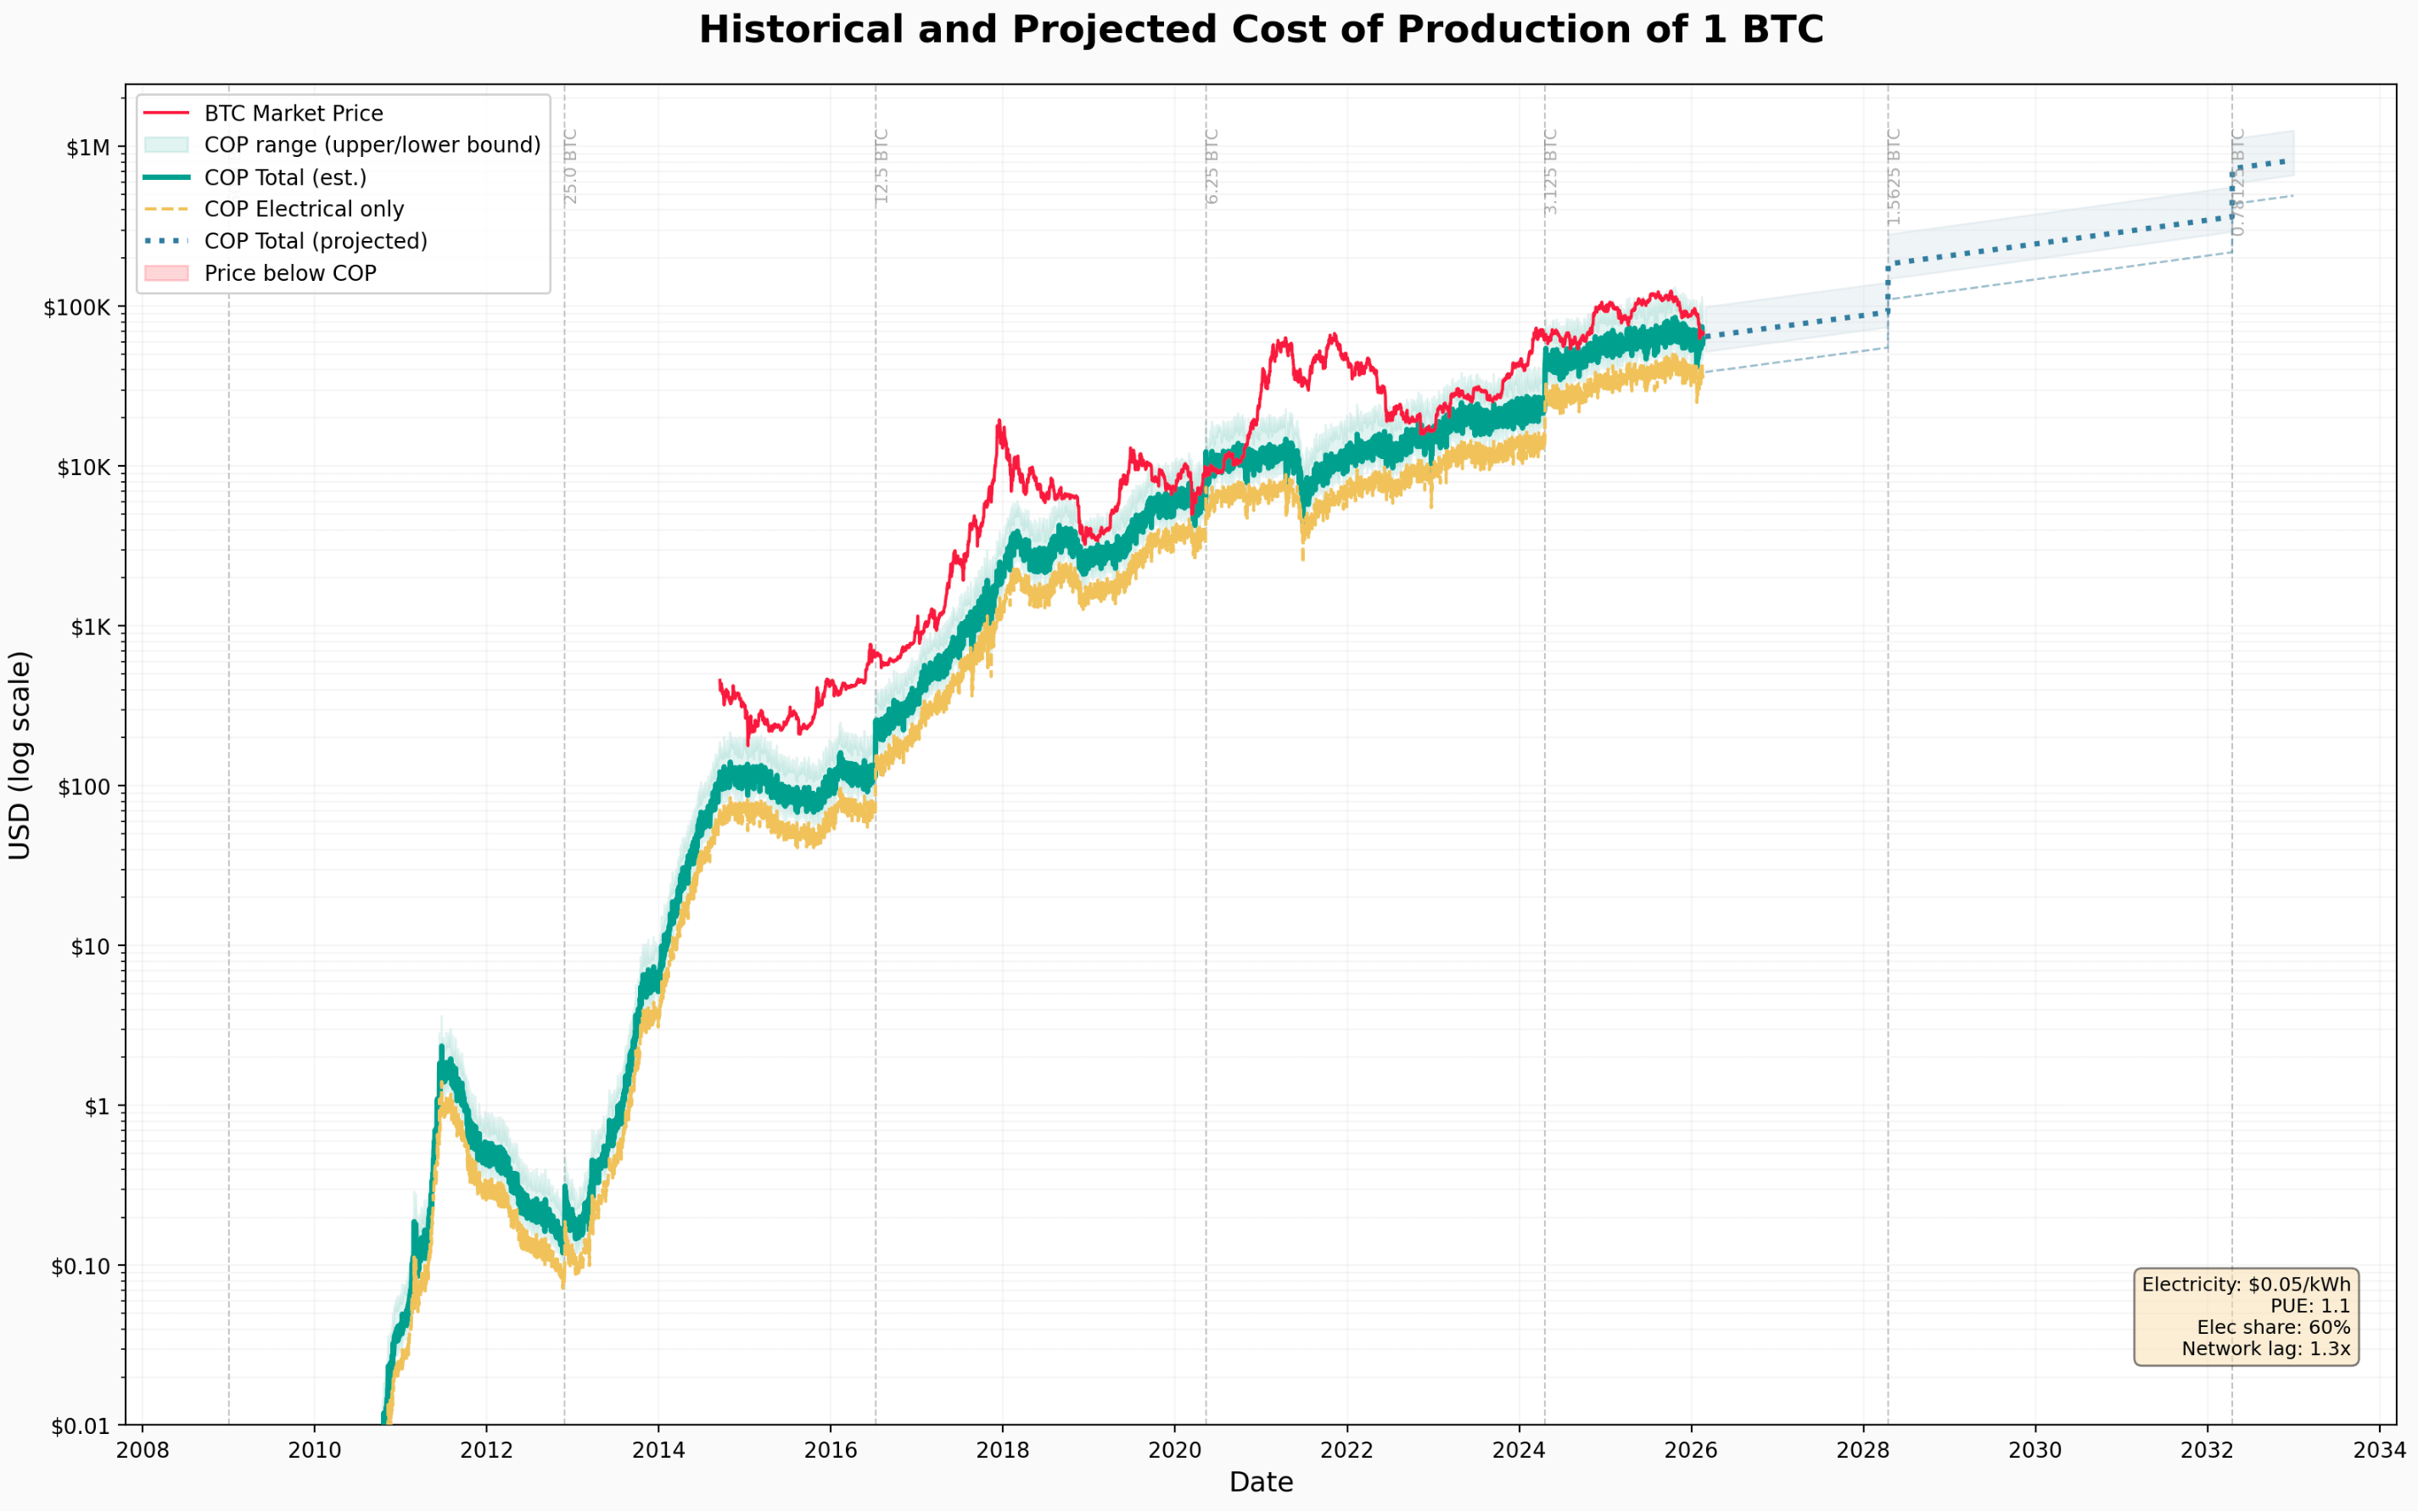
Part 9: Historical and Projected Cost of Production of 1 BTC (Flagship Chart)
This is the central result of the research: a single log-scale chart overlaying BTC market price against the estimated cost of production from 2009 through 2032.
Chart elements:
-
Red line: BTC market price (daily close)
-
Teal solid line: COP Total (estimated full cost of production)
-
Gold dashed line: COP Electrical only (60% of total)
-
Teal shaded region: COP uncertainty range (upper/lower bounds based on fleet efficiency assumptions)
-
Blue dotted line: Projected COP Total (2026-2032)
-
Red shaded areas: Periods where BTC price fell below COP (miner capitulation zones)
-
Vertical grey dashed lines: Halving dates with block reward labels
Historical narrative visible in the chart:
2014-2016: During Bitcoin's first well-documented bear market, the price crashed from ~$1,100 to below $200 and briefly touched the COP line. Mining was concentrated in China with relatively cheap electricity, keeping the cost floor low (~$100-$250).
2016-2017 (3rd halving cycle): The 2016 halving doubled the COP. The subsequent 2017 bull run sent BTC to ~$20,000 while COP remained around $1,000-$3,000, creating a wide gap that attracted massive mining investment.
2018-2019 (bear market): BTC crashed to ~$3,200. The price repeatedly tested the COP line, and periods where price dipped below COP are visible as red-shaded zones. These correspond to known miner capitulation events where less efficient operations shut down.
2020 (4th halving): The May 2020 halving pushed COP from ~$6,000 to ~$10,000-$12,000. The subsequent bull run to $69,000 (Nov 2021) again opened a wide price-to-COP gap.
2022 (bear market): BTC fell to ~$16,000 in late 2022. The COP at that time was ~$18,000-$20,000, and the chart shows the price dropping below COP -- another capitulation period that forced mining consolidation.
2024 (5th halving): The April 2024 halving pushed COP from ~$23,000 to ~$45,000. By February 2026, with continued hashrate growth, COP has risen to ~$61,600 while BTC trades at ~$67,900 -- a historically narrow 10% premium.
Projection (2026-2032):
The projected COP line continues upward, driven by three forces:
- Continued (decelerating) hashrate growth
- Slowing efficiency improvements approaching the thermodynamic floor
- The 2028 halving (reward drops to 1.5625 BTC) and 2032 halving (reward drops to 0.78125 BTC)
Projected COP milestones:
-
In the cycle following the 2028 halving: ~$200,000 (the floor does not jump to this level at the halving itself — it grows toward it through the cycle)
-
By 2032 halving: ~$561,000
-
End of 2032: ~$820,000
These projections assume constant electricity costs ($0.05/kWh) and mining cost structure (60% electricity share). In reality, both will evolve -- but the projections provide a baseline trajectory for the fundamental cost floor.
Conclusions
- The COP model works as a long-term floor. Historically, BTC price has spent limited time below the estimated cost of production. When it does, miner capitulation reduces supply pressure and supports price recovery.
- Halvings are the dominant COP driver. Each halving approximately doubles the cost of production overnight, creating a step-function in the cost floor. This is the most predictable and significant input to the model.
- Efficiency improvements are decelerating. The dramatic 1,000x improvement in mining hardware from 2013-2026 is unlikely to repeat. With the best hardware already at 9.5 J/TH and a thermodynamic floor near 5 J/TH, the scope for further efficiency gains is limited to roughly 2x.
- Hashrate growth is slowing. Doubling time has increased from ~130 days in 2018 to ~700 days in 2025. The network is maturing, and future hashrate growth will be more moderate than the explosive early years.
- Current BTC price ($67,854) sits only 10% above estimated COP ($61,623). This is a historically tight margin, suggesting either the cost model is approaching a ceiling, or the price is near a local floor relative to mining economics.
- Projected COP of $200K in the cycle after the 2028 halving and $820K by end of 2032 should be interpreted as baseline estimates. They assume no structural changes to electricity costs, mining economics, or Bitcoin's monetary policy. The actual trajectory will depend on these evolving factors.
Model Assumptions & Limitations
-
Electricity cost held constant at $0.05/kWh globally. In reality, mining electricity costs range from $0.02-$0.12/kWh depending on location and energy source.
-
The 60% electricity share is a rough industry average. Newer operations in regions with stranded energy may have higher electricity share (lower total overhead); operations in regulated jurisdictions may have lower.
-
Network efficiency lag factor (1.3x) is an estimate. The actual fleet composition is unknown.
-
Pre-2014 price data is unavailable from Yahoo Finance, limiting the historical price overlay.
-
The model does not account for transaction fee revenue, which becomes increasingly significant as block rewards decrease.
-
Projections assume no protocol changes, regulatory disruption, or energy market shocks.